learn-dtree is given a set of
training data
NOTE: The converter I used to create images from the mathematical equations and symbols wasn't working exactly right; that's why you see the horizontal and vertical bars below.
NOTE: In the following discussion, the two classifications "positive" and "negative" are used. For Problem 3 you may assume that there are just two classifications, but you should NOT make any assumptions as to exactly what they are (e.g. yes, no, positive, negative, edible, poisonous, etc.) It's probably not that much more difficult to write your code so that it works with an arbitrary number of classifications.
The chi-squared test is a measurement of whether splitting on a given attribute matters. Before splitting on an attribute, we can characterize how many examples there are for each classification and see how closely each split follows these proportions. If the attribute doesn't matter, then we'd expect that each "split" of training data (as divided by this attribute) to have approximately the same fraction of examples in each classification as the training data did before splitting on this attribute
Suppose the current call to the learn-dtree is given a set of
training data ![]() . These data have mixed classifications; the number
of positive examples in
. These data have mixed classifications; the number
of positive examples in ![]() is
is ![]() , and the number of negative
examples is
, and the number of negative
examples is ![]() . We know that
. We know that ![]() .
.
Through the information analysis, we have picked an attribute that
splits ![]() into a number of subsets
into a number of subsets ![]() . Each of these subsets will
(in general) have mixed classifications. Let
. Each of these subsets will
(in general) have mixed classifications. Let ![]() be the number of
positive examples in
be the number of
positive examples in ![]() and
and ![]() be the number of negative
examples. We know that
be the number of negative
examples. We know that
![]() .
.
If this attribute was irrelevant, then we would expect that the number
of positive examples in ![]() would be:
would be:
If ![]() is small, that means that the attribute is not relevant -- the
data in each split are following the same distribution as the data
before splitting on this attribute. If
is small, that means that the attribute is not relevant -- the
data in each split are following the same distribution as the data
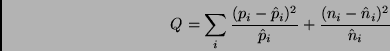
before splitting on this attribute. If ![]() is large, that means that there is a lot of "error"
between what we would have expected (under the irrelevant attribute
hypothesis) and the actual distribution of examples.
is large, that means that there is a lot of "error"
between what we would have expected (under the irrelevant attribute
hypothesis) and the actual distribution of examples.
The ![]() distribution will determine the probability that the attribute is not
relevant. I have provided a Scheme implementation of this function in
the support code:
distribution will determine the probability that the attribute is not
relevant. I have provided a Scheme implementation of this function in
the support code:
(chi^2 dof Q)You should use
dof = (number of values of this attribute) - 1
The chi^2 procedure will return a probability between 0 and 1 which indicates that our hypothesis (that this attribute doesn't matter) is correct. We will set a low threshold for this test: if the probability is greater than 0.001, then we will assume that the hypothesis is correct.
Although this threshold may seem low, consider the following quote from "Numerical Recipes in C"
It is not uncommon to deem acceptable on equal terms any models with, say, Q > 0.001. This is not as sloppy as it sounds: truly wrong models will often be rejected with vastly smaller values of Q, 1e-18, say.
If the "irrelevance hypothesis" is deemed correct, then you should not split on this attribute -- instead just pick the majority classification.
For your information, my Scheme implementation of the chi^2 function follows the algorithm from the book "Numerical Recipes in C" for computing the gammq function.
(pick-random-subset s size)This will randomly pick "size" elements from the list "s".
You should find it simple to write a procedure to help you run these tests. Show the performance on the training data and the testing data on the same plot. (The x axis should be the data set size, and the y axis should be the fraction of examples classified correctly. There should be two curves on the plot: one for performance on the training data and one for the testing data.)
(discretize-attribute training-data attribute-names attribute)which will discretize a single attribute specified by the "attribute" argument. It should return a function that will discretize the specified attribute on a data set. Here's an example discretize-attribute function that picks a random threshold for the given attribute:
(define (discretize-attribute training-data attribute-names attribute)
  (let* ((attribute-pos (- (length attribute-names)
                           (length (member attribute attribute-names))))
         (threshold (+ (random 10) 18)))
    (display "The randomly picked threshold is ")
    (display threshold)
    (newline)
    (lambda (data-set)
      (map (lambda (example)
             (let ((class (car example))
                   (attributes (cadr example)))
               (list class
                     (append (list-head attributes attribute-pos)
                             (if (> (list-ref attributes attribute-pos)
                                    threshold)
                                 '(high)
                                 '(low))
                             (list-tail attributes (+ attribute-pos 1))))))
           data-set))))
Here's how it works on the following data set to discretize the "age"
attribute:
(define test-data '((healthy (22 ok  low))
		    (ill     (23 bad medium))
		    (ill     (19 bad high))
		    (healthy (25 bad low))
		    (ill     (14 ok medium))
		    (ill     (23 ok medium))
		    (healthy (35 bad low))))

(define test-names '(age blood-pressure height))

(define disc-fn (distretize-attribute test-data test-names 'age))
The randomly picked threshold is 22

(disc-fn test-data)
; Value: ((healthy (low ok low))
          (ill     (high bad medium))
          (ill     (low bad high))
	  (healthy (high bad low))
	  (ill     (low ok medium))
	  (ill     (high ok medium))
	  (healthy (high bad low)))
Although here I've used a binary attribute, you code could use an
attribute with more than two values. Note that you will have to use
"generic" attribute values (e.g. "low" and "high" since there is no
provision to supply a list of attribute values that might make sense
with the given attribute.)
The examples in this database consist of a number of continuous-valued measurements of a tissue sample; the classification is whether the sample is malignant or benign. Since this database consists entirely of continuous attributes, you can either discretize all of them, or you can use a subset of them, i.e. just remove the attributes that you haven't discretized.
The measurements were done automatically from digitized images. You can see some of the original images at http://dollar.biz.uiowa.edu/~street/xcyt/images/.
You should turn in your code for this problem through the Assignment 5 web tester. This web tester will not run any tests but will simply collect your code. You should turn in on paper a short (definitely no more than 2 or 3 pages) description and analysis of how your discretize function did on the Wisconsin breast cancer database.